This month on the blog looks at human ancestry and migration. The last post related to an extinct Paleo-American group and their migrations into and through the Americas. This post is more personal — my distant ancestry and their migrations. I participated in the Genographic Project and had my DNA analyzed to identify my maternal and paternal ancestor’s migrations out of Africa and beyond. As of this post, I am 1 of 678,632 participants in the project. Anyone in the world can participate and make a contribution to science.
The human species — Homo sapiens — first evolved in Africa, which is where we have spent most of our time on Earth. Modern humans started to leave Africa between 60,000 and 70,000 years ago. They traveled in groups, along different migration routes. Our migrations across the planet are written in our DNA and can be traced by detecting the order in which these genetic markers appear over time. Anthropologists use these markers to produce a human family tree.
According to Wikipedia, the project began in 2005 as a not-for-profit collaboration between the National Geographic Society, IBM, and the Waitt Foundation. Proceeds from sales of the DNA test kits help fund cultural preservation projects nominated by indigenous communities.
The project is a genetic anthropology study that aims to map historical human migration patterns by collecting and analyzing DNA samples from hundreds of thousands of people from around the world. The first phase of the project looked at 12 genetic markers on mitochondrial DNA and the male Y-chromosome.
Mitochondrial DNA, or mtDNA, is passed from mothers to their children, but only their daughters pass it on to the next generation. It traces a purely maternal line. The Y-chromosome is passed from father to son, unchanged, from generation to generation down a purely male line.
Occasionally there is a mutation or naturally occurring, sometimes harmless, change in the DNA. Think of it as a typographical error in the DNA code of the gene. A mutation, known as a marker, acts as a signal that can be traced through generations because it will be passed down for thousands of years.
Geneticists can determine when the mutation first occurred, and in which geographic region of the world. Each marker is essentially the beginning of a new lineage on the human family tree. Tracking the lineages provides a picture of how small clans of modern humans migrated from Africa to other regions of the world.
The new Geno 2.0 version DNA test evaluates 150,000 genetic markers from across the entire genome using a new genotyping array – the GenoChip – specifically designed for anthropological testing. The chip design was the product of a collaboration between Dr. Eran Elhaik of John Hopkins, Spencer Wells of National Geographic, Family Tree DNA, and Illumina. The GenoChip analyzes proportions of genetic ancestry related to nine ancestral regions.
The GenoChip helps clarify the genetic relationships between ancient hominids and modern humans. It also provides a detailed history of human migration. Genetic anthropologists expect that the expanded use of the GenoChip will continue to expand our understanding of the history of Homo sapiens.
DNA analysis
After collecting two swabs from the inside of my cheek, I sent the samples the laboratory in Houston. A strict chain-of-custody protocol is applied to the samples that tracks handling and progress through the lab. Next, the lab isolates my DNA from the cheek swab and incubates the DNA overnight in solution containing an enzyme that dissolves the cheek cells, releasing the DNA.
The next day the DNA solution is transferred to a new tube containing specially coated beads that bind to the DNA when in the presence of certain chemicals. The beads (and my DNA) are then collected with magnetic probes and processed to purify and amplify the DNA. The beads are then placed in buffer solution, where the DNA is released from the beads. Samples are then analyzed using the GenoChip, which has hundreds of thousands of microscopic DNA probes, one for each nucleotide across the genome.
The GenoChip results are subjected to a validation step to check the data for accuracy and potential issues with the quality of the DNA sample. Samples with problems are flagged and re-analyzed. The lab technicians then compare the GenoChip results to those of hundreds of thousands of other participants and reference individuals to find my branch of the human family tree (haplogroup) and my ancestral regions.
Some of my Genographic Project results follow.
Regional ancestry
Regional ancestry — 5,000 years to 10,000 years ago — is determined from my entire genome, reflecting both parents’ genetic contributions, going back six generations. This result identifies my affiliations with a set of nine world regions:
- Northeast Asia
- Mediterranean
- Southern Africa
- Southwest Asia
- Oceania
- Southeast Asia
- Northern Europe
- Sub-Saharan Africa
- Native American
The result is understood as a mixture of both recent (past six generations) and ancient patterns over thousands of years. They should not be interpreted to mean that I belong to these groups or are directly from these regions, but that these groups were of a similar genetic match and can be used as a guide to understanding my result.
My regional ancestry is:
- 40% Northern European – This affiliation is found at highest frequency in the reference dataset for the UK, Denmark, Finland, Russia and Germany. It is likely the signal of the earliest hunter-gatherer inhabitants of Europe, who were the last to make the transition to agriculture as it moved in from the Middle East during the Neolithic period around 8,000 years ago.
- 39% Mediterranean – This part is found at highest frequencies in reference populations in Sardinia, Italy, Greece, Lebanon, Egypt and Tunisia; it is found at lower frequencies throughout the rest of Europe, the Middle East, Central and South Asia. This part is likely the signal of the Neolithic population expansion from the Middle East, beginning around 8,000 years ago, likely from the western part of the Fertile Crescent.
- 17% Southwest Asian – This ancestral line occurs at highest frequencies in India and neighboring populations, including Tajikistan and Iran in reference populations. It is found at lower frequencies in Europe and North Africa. Individuals with a strong European signal show traces of this component because all Europeans have mixed with people from this region over tens of thousands of years. The timing of expansion is similar to the Mediterranean component.
- 2% Northeast Asian – This part is detected at highest frequencies in reference populations from Japan, China and Mongolia. It is found at lower frequencies in southeast Asia and India, where it likely arrived in the past 10,000 years with the expansion of rice farmers coming from further north.
Deep ancestry
My deep ancestry — 1,000 years to 100,000 years ago — on my mother’s side of the family is identified as U8A1A, a haplogroup shared by 0.1% of all participants in the project. My paternal lineage is identified as R-Z212, which is shared by 0.6% of all participants in the project.
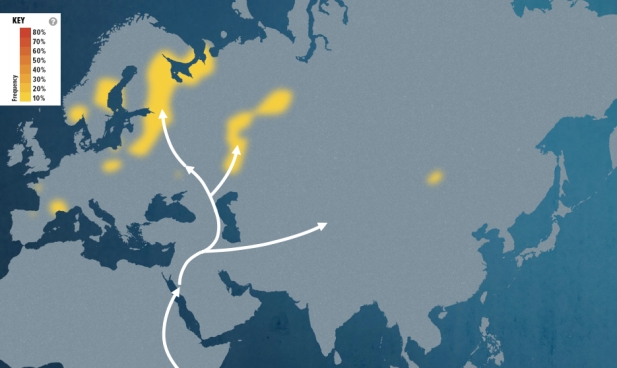
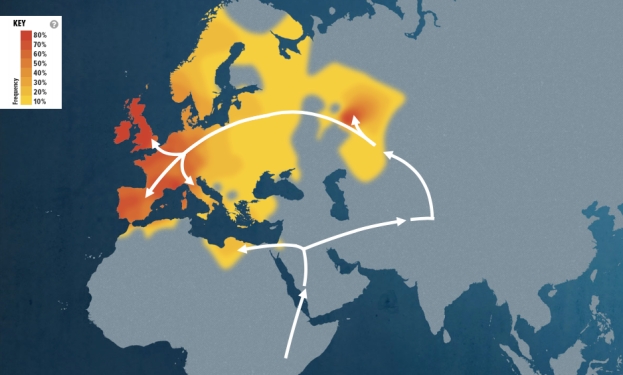
Each segment on the two heat maps shown below represents the migratory path of successive groups that converged to form my branch of the human family tree. The journey begins with the marker for my oldest ancestor and progresses to more recent times. The segments illustrate each step my maternal and paternal ancestors that lived up to that point.
The first map shows the frequency of haplogroup U8A1A in indigenous populations from around the world and where my more recent ancestors settled in their migratory journey. This result means I am distantly related to people in the areas highlighted on the map. As more people are tested worldwide, this information will grow and change. The colors on the map represent the percentage frequency of my haplogroup in populations from different geographic regions (red is high frequency).
According to the Genographic Project report…
“My maternal ancestors left Africa and settled around southeastern Europe. They then expanded north into the rest of Europe. They survived by hunting and finding wild food sources. In Europe, they met with those who were already there and formed new cultures that are reflected in the archaeological record. Thus, my cousins played an important role in the history of Europe.”
Points of interest in the maternal heat map:
- The first branch (L3) begins around 67,000 years ago and is shared by all women alive today; it is the major maternal branch from which all mtDNA lineages outside of Africa arose.
- This next line (N) is one of two founding lineages that migrated out of Africa about 60,000 years ago.
- The third group of descendants (R) originates around 55,000 year ago and dominates Europe, making up 75% to 95% of the maternal lineages there.
The map for my father’s side of the family is based on the closest haplogroup in my path that the Genographic Project has frequency data for — haplogroup P310. According to the Genographic Project report…
“The map of P310 shows a distribution in Europe that peaks in Western Europe where it experienced successful expansions, particularly after the end of the last ice age with the recolonization of northern Europe. There is also a peak in Bashkortostan, in Russia, likely due to a more recent founder event where one Y-chromosome lineage has risen to very high frequency due to a small number of related founding males.”
In addition, the report says…
“My paternal ancestors left Africa and moved north through western and Central Asia. They then turned west and crossed the grasslands of southern Russia into Europe. There, they eventually drove the Neanderthals to extinction, though they did interbreed with them. Living a hunter-gatherer lifestyle, my early ancestors set the stage for later European history.”
Points of interest in the paternal heat map:
- The first branch (M42) begins around 75,000 years ago and is shared by almost all men alive today.
- The second branch (M168) is one of the first groups to leave Africa about 70,000 years ago.
- The next line (M89) arose about 50,000 years ago in northern Africa or the Middle East, and is found in 90% to 95% of all non-Africans.
- The next group (P128) is found in more than half of all non-Africans and begins about 45,000 years ago.
- The fifth branch (M45) is known as the Central Asian Clan, which gave rise to many distinct lineages about 30,000 years ago.
Hominin ancestry
When our ancestors first migrated out of Africa around 60,000 years ago, they encountered at least two other species of hominin in Eurasia: Neanderthals and Denisovans, both of the genus Homo. Our modern human ancestors interbred with these hominin cousins, resulting in a small amount of Neanderthal and Denisovan DNA being introduced into the Homo sapiens gene pool. Neanderthal and Denisovan species are now extinct, but the genetic makeup of nearly everyone born outside of Africa today contains 1% to 4% DNA from these other hominins. Most non-Africans are about 2% Neanderthal and slightly less than 2% Denisovan. My hominin ancestry (60,000 years ago and older) includes 1.7% Neanderthal and 1.1% Denisovan.
Now I can provide a better answer the next time I’m asked about my ethnicity. 🙂


Awesome. My paternal lineage is also R-Z212. Whats interesting is I’m 47% native American. I’m guessing due to other ethnicities identified i had a Spanish or Irish ancestor that traveled to Texas area.
LikeLike